Welcome to WeatherMaine
Welcome to WeatherMaine


Trailing Edge of Squall Line
Winter weather returned with a vengeance on the heels of a distinct and vigorous squall line.
A temporary warm-up from the recent record cold was interrupted in the afternoon by a very strong squall line that passed through the Portland area starting at around 2:30pm. The Dew Point at 2:30pm at WeatherMaine was 30°F ahead of the squall line. A rapid drop in dew point was observed at WeatherMaine's South Portland, Maine location. By 6:30pm had already dropped to -6°F! That is a 36° drop in 4 hours, or 9°F per hour! A marked temperature drop was also observed, dropping from 32°F to half of its value,16°F, at 6:30pm.
Visibility on I-295 was reduced to almost nil during the onset of the squall. As typical of most squall lines, this one was distinct and brought with it heavy snow bursts and strong winds; 26 mph wind from the NW was observed at WeatherMaine for many hours following frontal passage.
ven more impressive is the drop in temperature after the frontal passage. The temperature at WeatherMaine at 2:20pm on 1/13/04 was a relatively warm 37.5°F, but at 2:20am on the 15th the temperature had dropped to -5.4°F, a change of over 42°F in 12 hours! This is the most intense 12-hour temperature change noted at WeatherMaine is its history.
More record cold and extreme windchills are expected for the next few days in Maine.
The Mercury in Maine barely managed to move during the day today as a result of an arctic high pressure system- the first real arctic outbreak of the season to hit Maine. Portland, Maine set a new record with a high temperature of 6°F. This breaks the old record for lowest high daily temperature on this date.
December, 2003 has kept our shovels busy and our rivers running high.
Several large winter storms dropped as much as 5 feet of snow in one week over much of the interior of Maine. This remarkable snowfall, however, has been eroded away by several large rain storms.
The overall weather patterns in December featured two predominant storm tracks. The first being the classic Nor'easter track, with upper-level energy swinging into the Southeast spawning a coastal low which then moves up the coast toward New England. The second being a 'warm track' which featured two major storms tracking through western New York. This pattern eventually brings warm air in at all levels of the atmosphere. Freezing rain occurs often with this track due to cold air damming.
The result of the two major snowstorms staggered with two major rain storms is major flooding. Canton, Maine was overwhelmed with river water after the tremendous snowpack melted under warmer temperatures and rain water. The relatively thin river ice sheets were broken up and caused many ice jams around the region, including Farmington, Maine and Plymouth, New Hampshire. Several students' cars at PSU were flooded out and severely damaged by the Pemigewasset river.
The contrast between Christmas weather this year and Christmas last year is quite interesting. Last year, of course, was the December Blizzard- at WeatherMaine in South Portland, over 19 inches of snow was received during this event. This year's weather was that of rain and fog, a far-cry from the digging out of last year. The fog during Christmas eve night was very thick, and was the result of warm, moist air moving over our snowpack. The cold surface snow and ice cools the air near the surface. Since the amount of water the air can hold depends directly on its temperature, colder air can hold less water. As the air cools near the ground, it becomes saturated- like a towel than can hold no more water. This results in fog. There are complex processes involved with fog over snow, but it is mostly seen during 'warm track' storms in the winter.
The Winter snow season got off to a strong start with a major East-coast 'Nor-Easter'.
This storm impacted many parts of the United States East Coast, bringing snow from the Mid-Atlantic states into Canada. This storm was a classic example of a true Nor-Easter with secondary redevelopment. Media outlets gave the term 'One-Two Punch' to this storm, since it brought snow in two distinct intervals. The primary storm dipped into the Gulf-Coast region and had good upper-level support. The primary storm brought an early snow to our Nation's capital, while the secondary storm brought snow to the Northeast. This storm was occluded by the time it reached New England. Occluded lows occur when the Cold front 'reaches' the Warm front, resulting in a relatively homogeneous environment and limited frontal dynamics. This can also be called a Neutral Occlusion. This resulted in the moisture and upper-level dynamics (Jet Streaks) being displaced to the East of Maine. This limited the snowfall totals along the coastal regions.
The interior regions of Maine had enhanced snowfall due to the location of the 'deformation zone' and to Upslope flow. The Deformation zone is defined as 'The change in shape of a fluid mass by spatial variations in the velocity field, specifically by stretching or shearing.' The upslope winds are winds that blow over terrain of increasing height. This results in oragraphic lifting and essentially 'squeezes' water out of the air, resulting in enhanced precipitation amounts. This Nor-easter had a fairly well-defined 'eye' in the visible satellite imagery. Also of note was a tropical system in the Atlantic (December is not in "season" for tropical systems). This tropical system was later absorbed by the Westerlies in the trough from which this storm got its upper-level support.
Snow fall totals over the region were extremely variable. Here in South Portland (Coastal Cumberland County- zone 24), we only got about one foot of snow, while Bridgton (Interior Cumberland- zone 19) officially got 32.1 inches of snow! The jackpot of snow in this storm was located in the Mountainous regions of Maine and New Hampshire. Rangely, Maine got 41.0 inches of snow, while Pinkham Notch in New Hampshire got 52 inches of snow in this one storm! Also of note with this storm is strong winds. Mount Desert Rock reported a wind gust of 82 mph!
A very active solar region with a complex sunspot pattern erupted this (EST) morning. The flare was registered by the GOES12 satellite at the X17 level, making it an S4 on the SEC's Space Weather scale. The active region was positioned perfectly near the Sun's central meridian at the time of eruption. The position of the region on the face of the Sun means that any material ejected, a CME, is likely coming right at the Earth.
The material ejected is part of the Sun's corona and is really a giant cloud of magnetized plasma; plasma is the 'fourth state' of matter (solid, liquid, gas, plasma) and consists of ions. The plasma acts like a giant liquid magnet, with truly awesome power. When this giant magnetic cloud interacts with the Earth's magnetic field, several side effects can be witnessed. If the magnetic orientation of the cloud is the opposite of the Earth's own magnetic field, then severe impacts on the surface of the Earth can be felt.
This flare is one of the largest of the current solar cycle, and past events of this magnitude have resulted in severe geomagnetic activity. Even though the D-region absorption from the x-rays is mostly over after the flare is over, the protons and electrons emitted by the eruption are causing the polar regions to absorb radio waves. The SEC has issued an A-index greater than 100 warning, meaning they expect severe geomagnetic storming from this event. It is interesting to note that this flare was rated at the maximum levels for both visual area and brightness, rating: 4B.
Addenda: Only a few days after the X17 flare erupted, the same active region produced an X10 flare with associated halo CME. The result of these flares was a severe period of storming for a couple of days. Bright Aurora were seen in Portland, even over the city lights. Aurora could be seen to the North, with rays and curtains being the predominant modes of presentation.
|
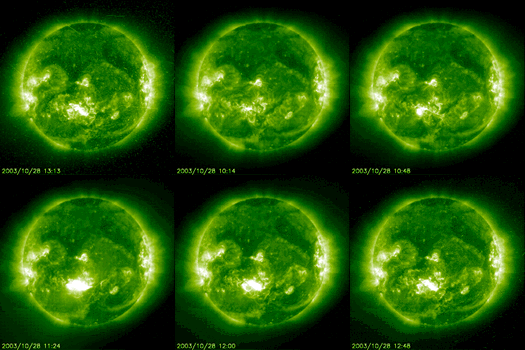
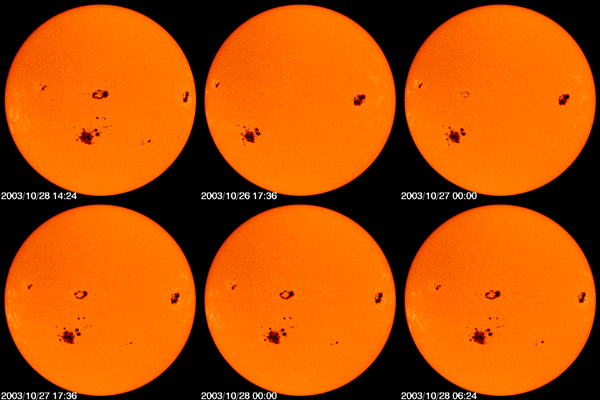
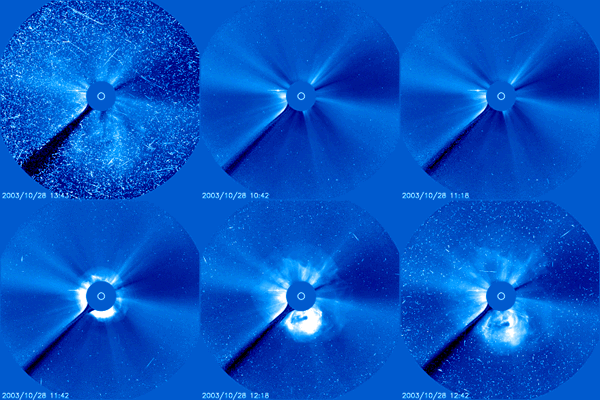
Images of the October 28, 2003 X17.2 Solar Flare
(note: the images are not chronologically aligned) |
||
|
Extreme UV (195nm) Image
Animation Of Solar Flare |
MDI Continuum Image Animation
Showing Sunspots |
SOHO C3 Coronagraph Animation
Showing CME |
 |
 |
 |
| (images courtesy NASA/SOHO) (animation by Max Riseman) |
(images courtesy NASA/SOHO) (animation by Max Riseman) |
(images courtesy NASA/SOHO) (animation by Max Riseman) |
| This image loop shows the X17.2 X-ray flare occuring near the middle of the solar disk. The CCD's pixels become overwhelmed by the intensity of the flare, causing their voltage to leak to neighboring pixels, resulting in the 'diamond' of light coming from the flare site. |
Region # 486 is the large region on the Southern portion of the solar disk. Region #10486 is the largest sunspot of the current solar cycle. |
The C3 Coronagraph shows the inbound CME that the X17.2 flare on October 28, 2003 produced. This CME had a perdominantly (+) Bz, making in not very efficient at producing a geomagnetic storm. The X10.0 flare had a (-) Bz on impact, thus producing widespread aurora. |
Summary of Very Active Solar Period
|
X-Ray Flare Class
|
Location Of (H-Alpha) Flare
|
H-Alpha Importance
|
Flare Type
|
Region
|
Duration
(x-ray) |
Start Date/Time
(UTC) |
|
X1.1
|
N08E58
|
1N
|
PRB
|
484
|
35 min
|
10/19/03 16:29
|
|
X5.4
|
S21E88
|
1B
|
BPT
|
486
|
30 min
|
10/23/03 08:19
|
|
X1.1
|
S17E84
|
1N
|
ERU
|
486
|
24 min
|
10/23/03 19:50
|
|
X1.2
|
S15E44
|
3B
|
?
|
486
|
96 min
|
10/26/03 05:57
|
|
X1.2
|
N02W38
|
1N
|
ERU
|
486
|
120 min
|
10/26/03 17:21
|
|
X17.2
|
S16E08
|
4B
|
PRB
|
486
|
93 min
|
10/28/03 09:51
|
|
X10.0
|
S15W02
|
2B
|
UMB
|
486
|
24 min
|
10/29/03 20:37
|
|
X8.3
|
S14W56
|
2B
|
UMB
|
486
|
33 min
|
11/02/03 17:06
|
|
X2.7
|
N10W77
|
2B
|
ERU
|
488
|
35 min
|
11/03/03 01:09
|
|
X3.9
|
N08W77
|
2F
|
ERU
|
488
|
36 min
|
11/03/03 09:43
|
|
X28*
|
S19W83
|
3B
|
UMB
|
486
|
37 min
|
11/04/03 19:29
|
* largest ever recorded up to this point
ERU = Multiple Eruptive Centers UMB = (>= 20%) Umbral Coverage BPT = One or More Brilliant Points |
|
S = <= 2.0 square degrees 1 = 2.1 to 5.1 square degrees 2 = 5.2 to 12.4 square degrees 3 = 12.5 to 24.7 square degrees 4 = > 24.8 square degrees |
|
|
Intensity of Flare: |
|
|
|
| This is the location of the flare as observed at the H-alpha wavelength. E refers to the Eastern, or 'new', region of the solar disk. W refers to Western, or limb. The limb is the location that represents the horizon of toward or away from Earth. N and S refer to North and South hemispheres of the Sun, respectively.. |
|
Space Weather Alerts Issued By The SEC
(during the active period) |
|---|
|
SPACE WEATHER ADVISORY BULLETIN #03- 5 **** EXTREME SOLAR FLARE **** Powerful Active Region 486 has produced one of the most intense solar flares ever measured. The event began at 12:29 P.M. MST (1929 UTC) on November 4th and rose quickly to exceed X17 on the GOES-12 X-ray sensor. By 12:44 P.M. MST (1944 UTC), the GOES sensor was saturated and remained that way until 12:56 P.M. (1956 UTC), suggesting this event extended well in to the very highest flare category, the X20 plus range. This massive flare produced a category R5 (extreme) radio blackout. All short-wave communications through the sunlit hemisphere of the Earth experienced complete blackout conditions. A powerful, and extremely fast (over 5 million miles per hour) mass ejection occurred from this flare site, but is mostly directed away from Earth. As a result, only category G1 (minor) to G2 (moderate) geomagnetic storm levels are likely on November 6th. This solar flare was the largest in a series of very large flares that have occurred in Active Region 486 over the past two weeks. At its peak, this sunspot cluster was approximately 15 times larger than Earth. This active region will rotate to the backside of the sun over the next 24 hours. Another large flare is still possible from this region, but large flare activity will become much less likely after the next 24 to 48 hours. |
|
**** MAJOR SOLAR AND GEOMAGNETIC ACTIVITY CONTINUES **** The intense solar flare (category R4 radio blackout - severe) that occurred on October 28th at 1110 UTC (6:10 A.M. EST) and its associated coronal mass ejection (CME) produced a category G5 (extreme) geomagnetic storm starting at 0613 UTC (1:13 A.M. EST) on October 29th. This geomagnetic storm lasted for twenty-four hours and produced category G3 (strong) through category G5 (extreme) conditions. This intense activity is occurring unusually late in this solar cycle, it has also produced the second largest solar flare and solar radiation storm of the cycle. The primary source of this activity, NOAA Active Region 486, has become the largest sunspot region observed during this cycle. |
|
SPACE WEATHER ADVISORY BULLETIN #03- 3 **** SOLAR ACTIVE REGION PRODUCES INTENSE SOLAR FLARE **** The dynamic solar regions reported on 21 October continue to produce high levels of solar activity. NOAA Region 486 produced a category R4 (severe) radio blackout with an associated category S3 (strong) solar radiation storm on 28 October at 1110 UTC (6:10 A.M. EST). The SOHO/LASCO instruments also observed a full halo coronal mass ejection with this activity, which is Earth directed. This region is the second largest in size this solar cycle. Further major eruptions are possible from these active regions as they rotate across the face of the sun over the next few days. Agencies impacted by solar flare radio blackouts, geomagnetic storms, and solar radiation storms may experience disruptions through this period. These include spacecraft operations, electric power systems, HF communications, and navigation systems. |
| SPACE WEATHER ADVISORY BULLETIN #03- 2 2003 October 21 at 06:11 p.m. MDT (2003 October 22 0011 UTC) **** INTENSE ACTIVE REGIONS EMERGE ON SUN **** Two very dynamic centers of activity have emerged on the sun. NOAA Region 484 developed rapidly over the past three days and is now one of the largest sunspot clusters to emerge during Solar Cycle 23, approximately 10 times larger than Earth. This region, which is nearing the center of the solar disk, already produced a major flare (category R3 Radio Blackout on the NOAA Space Weather Scales) on 19 October at 1650 UTC. The region continues to grow, and additional substantial flare activity is likely. Further major eruptions are possible from these active regions as they rotate across the face of the sun over the next two weeks. Agencies impacted by solar flare radio blackouts, geomagnetic storms, and solar radiation storms may experience disruptions over this two-week period. These include satellite and other spacecraft operations, power systems, HF communications, and navigation systems. |
 |